According to official statistics, living standards are rising, inflation is low, and unemployment is falling.
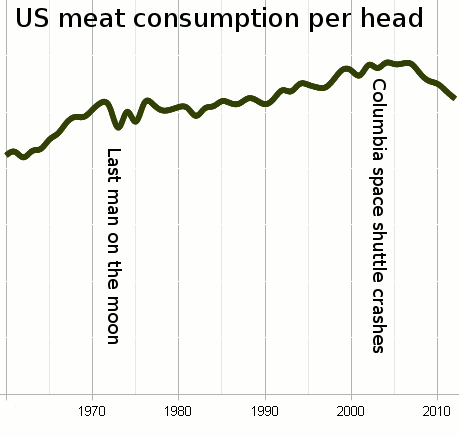
If living standards are rising, why are people eating less meat and buying fewer cars?
[In the comments Bill makes a telling rebuttal: That people are eating less meat and buying fewer cars because of increasing inequality accurately reported by the official statistics: that the decline in equality renders official statistics compatible with consumption statistics for particular items.]
Median real household income in the US:
2005 40,206
2006 40,848
2007 41,116
2008 39,493
2009 39,186
2010 38,043
The peak was in 2007 which looks to be in pretty good agreement with the peak of your graph. So, official statistics do not indicate rising living standards. I can’t find 2011 numbers. Presumably they have not been released yet.
Rather famously, median wages have not risen in the US since about 1973. Median household income in 1973 in 2010 dollars was 37,086. This is a pretty tiny increase over the last 40 years. Of course, household composition has been changing over that time as well, so that comparison is maybe unfair.
The top five percent have had their income rise rapidly over that same time period, as the 95th %ile of real household income went up from 1973-2010 from $127K to $181K. Average incomes have been rising over the whole period from 1973 (though not every year of course). This is because the rich continue to get richer. The thing is, when your annual income goes up from 15 to 30 million a year, you don’t tend to eat all that much more meat.
You’ve found an index which reproduces the conventional wisdom. Income growth from WWII to 1973 or so went disproportionately to lower income types while income growth from 1973 to present went almost exclusively to high income types. It would be nice to see the meat index extended further back in time.
The usual rejoinder to this is that the household is collapsing, that families are ceasing to exist. The average number of people in a household gets smaller every year. But, in fact, recently has stopped getting smaller, because the kids are no longer leaving home.
So you are right. In that meat consumption reproduces median household income, falling meat consumption is not evidence that official statistics are cooked.
I have noted your response in the article.
Peter Schiff explains that the Boskin Commission deliberately skewed the CPI so that it would show a lower number:
Peter Schiff – The Fed Unspun: The Other Side of the Story
http://www.youtube.com/watch?v=zdB9I79BQRI#t=80m12s
He also says that gas prices are the result of inflation rather than a lack of domestic production or than “price gouging” by oil cartels:
The truth about rising gas prices, the stock market, & Warren Buffett’s taxes
http://www.youtube.com/watch?v=eQYy25kLijA